
Results from Ad Optimization — Not Just Analytics
Every case study below is the result of RicoSystems actively rebuilding, optimizing, and managing paid campaigns for maximum performance and minimum cost. These are not just tracking results — they are optimization outcomes.
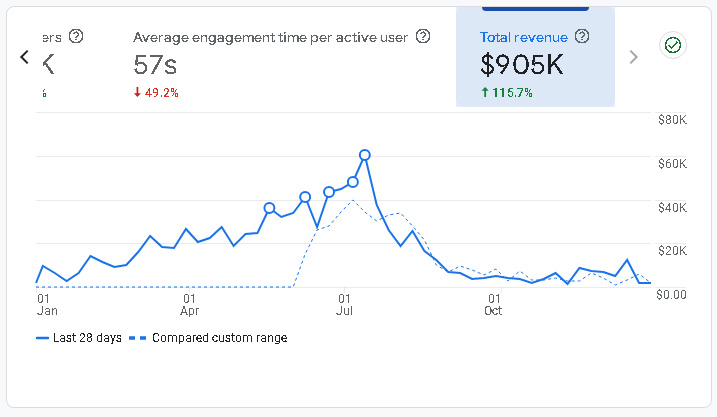
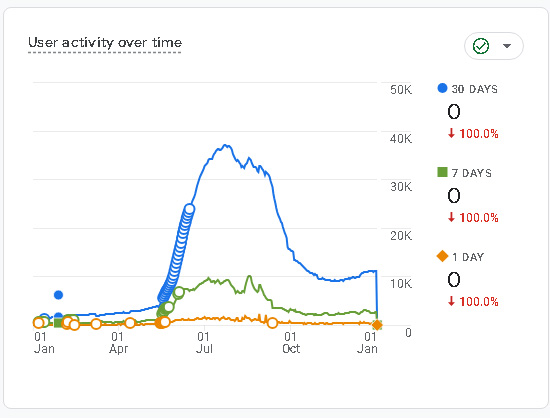
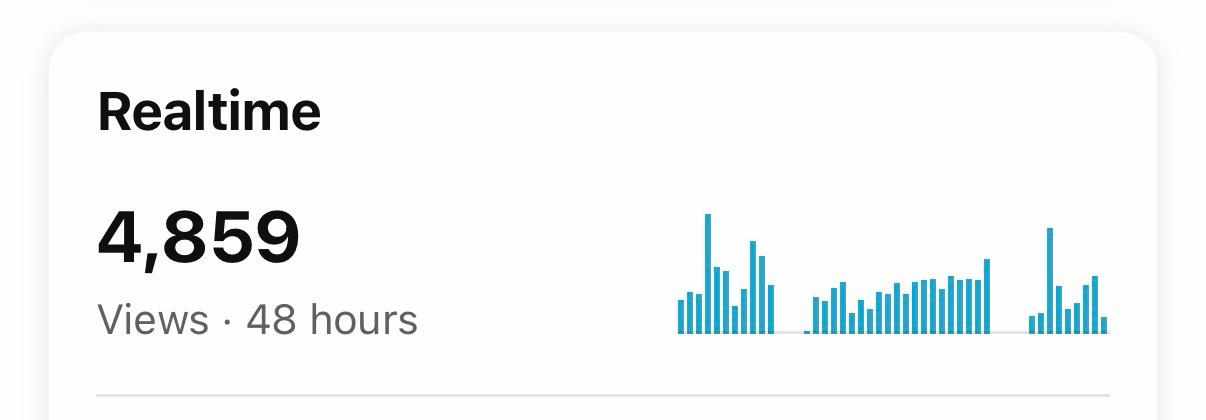
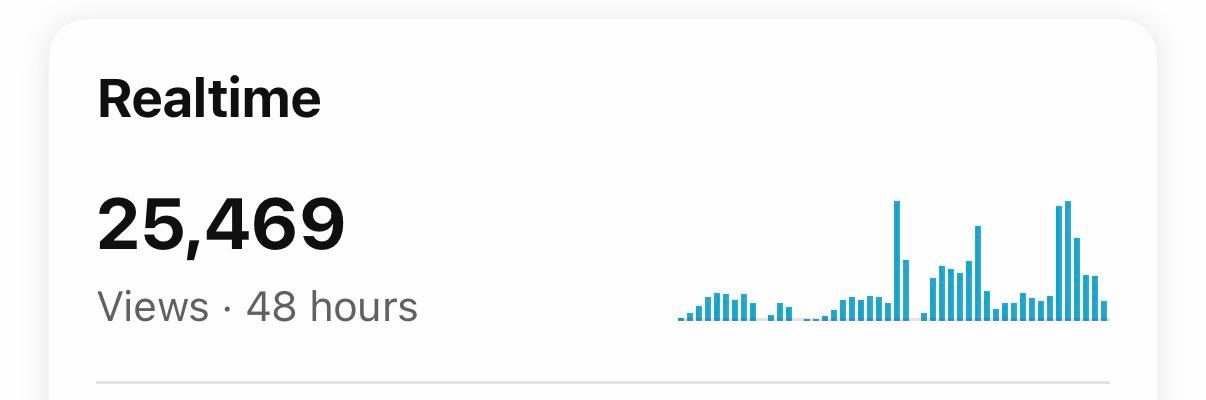
Raw Proof: Screenshots & Live Data
Direct screenshots from Google Ads and Analytics. No mockups, no stock images. These interfaces can't be faked.
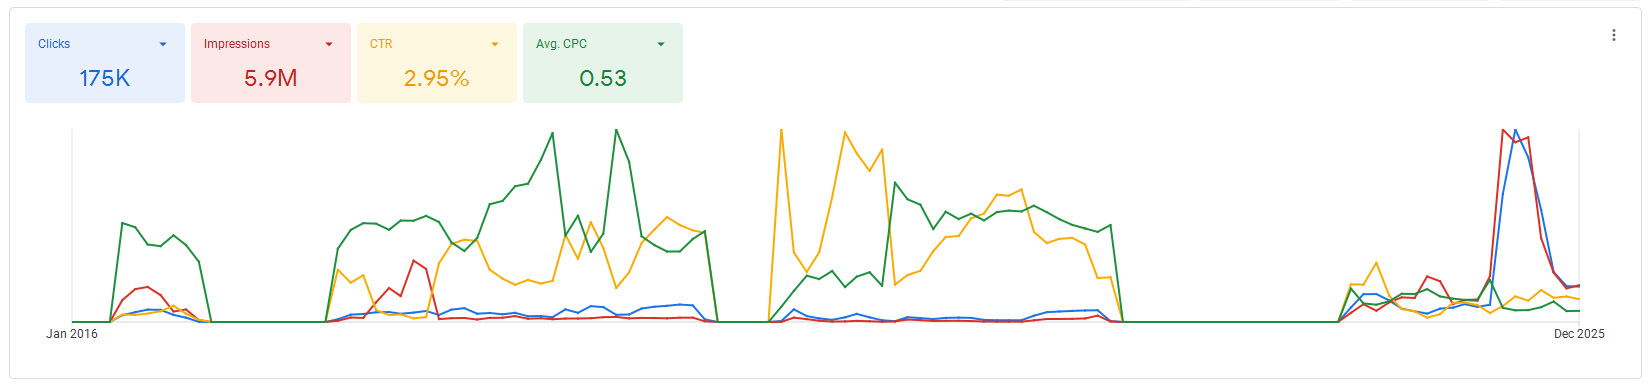
Boutique Resort
Hospitality & Tourism
The Challenge
A boutique resort needed to forecast bookings with accuracy to support operational planning and revenue projections. Traditional marketing produced unpredictable results that made business planning difficult.
They required a system that could generate predictable customer acquisition costs across seasonal fluctuations.
Our Forecast
Based on systematic testing and proprietary models, we projected:
- Click-through rate: 3.5–5%
- Cost per click: $0.08–0.12
- Sustainable performance over extended periods
- Scalable across multiple campaign types
Results Delivered
Business Impact
Industry Average
RicoSystems Delivered
Accounting SaaS Platform
B2B Technology
The Challenge
A SaaS startup needed to validate paid acquisition as a scalable growth channel. With limited budget, they required confidence that customer acquisition costs would support their unit economics.
They needed forecasted CAC before committing growth capital.
Our Forecast
Based on cross-industry validation and business model analysis, we projected:
- Click-through rate: 1.5–2.5%
- Cost per click: $0.12–0.18
- Rapid scaling during learning phase
- Path to 600+ subscribers from initial deployment
Results Delivered
Early Phase — Day 4Projected Impact
Why Early Results Matter
Learning phase (Days 1–14) shows lower performance that improves as algorithms optimize. Our models account for this maturation curve, providing accurate long-term forecasts from early-phase data.
Business Consulting
Professional Services
The Challenge
A consulting firm needed qualified leads for high-value engagements. Traditional lead generation produced inconsistent results with unpredictable costs per qualified opportunity.
They required a system that could forecast lead acquisition costs to support sales pipeline planning.
Our Forecast
Based on B2B service validation, we projected:
- Click-through rate: 1.8–2.2%
- Cost per click: $0.18–0.24
- Qualified lead generation for complex sales cycles
- Consistent performance across different service offerings
Results Delivered
Business Impact
- Predictable lead generation costs enabling sales forecasting
- Validated across multiple service lines
- Scalable acquisition system supporting growth planning
Previous Higher-Budget Campaigns
RicoSystems Optimized
High-End Furniture
Retail
The Challenge
A high-end furniture retailer needed to scale sales by $200K/month. Traditional retail advertising produced unpredictable results that made inventory and operational planning difficult.
Required forecasted customer acquisition costs based on unit economics.
Our Forecast
Based on cross-industry validation (hospitality, SaaS, services) and retail-specific modeling:
Why This Matters
This validates our methodology's transferability to retail — the 4th distinct industry vertical. Demonstrates cross-industry applicability of our proprietary models. Full case study available Q2 2026.
How We Deliver Predictable Results
(Without revealing our secret sauce)
Data-Driven Modeling
We build statistical models based on empirical observation, not platform recommendations or industry "best practices." Our forecasts have confidence intervals backed by cross-industry validation.
Need-Intensity Focus
We identify the highest-intensity customer needs in your market — not just product features. Creative assets address deep pain points, not surface-level messaging.
Systematic Validation
Every forecast is tested through controlled deployment. We measure actual vs. projected performance continuously, refining models based on real-world results.
Forecast-Backed Ranges
Because our models produce predictable outcomes, we commit to results within forecasted ranges. This isn't possible with guesswork — only with validated methodology.
What We Don't Share
The specific optimization techniques, platform mechanics, and strategic approaches that produce these results are proprietary intellectual property. That's why we can commit to forecast ranges while competitors can't.
Validated Methodology. Proven Transferability.
Different industries show different performance ranges — but all show predictable convergence within our forecasted parameters.
| Industry | CTR Range | CPC Range | Forecast Accuracy | Status |
|---|---|---|---|---|
| Hospitality | 3.5–5.0% | $0.08–0.12 | 96% | Validated |
| B2B SaaS | 1.5–2.5% | $0.12–0.18 | 90%+ | Validating |
| Professional Services | 1.8–2.2% | $0.18–0.24 | 94% | Validated |
| High-End Retail | 1.5–2.5% | $0.20–0.30 | TBD | Testing |
Ready to Know Your Numbers Before You Spend?
Every case study started with a forecast. Every client knew their expected results before committing budget.
No obligation consultation · Receive statistical forecast with confidence intervals · Zero risk
Get Your Free Forecast